Weather page - Explained
To reduce the download time of the main weather page these
explanations have been moved to their own page. This also
provides the opportunity to more fully describe what you see.
The weather station takes a round of measurements every minute.
Each bar in each graph represents an hour, always beginning a
minute 00 and ending at minute 59, so each bar is a summary of
sixty observations. There is no summary bar for the current
hour, since it has not yet reached its 59-th minute.
A guiding principle on the size of the weather page was that
if you print just page #1, you will have all the (important) data.
And now, the rest of a few short stories . . .
- Temperature
Top of RED bar -> Maximum (for hour)
Bottom of RED bar -> Minimum (for hour)
Bottom of BLUE bar -> Minimum (for period)
The bottom blue bar may be further split into green-over-blue
when it straddles the freezing mark. The green-blue boundary
represents 32 degrees F.
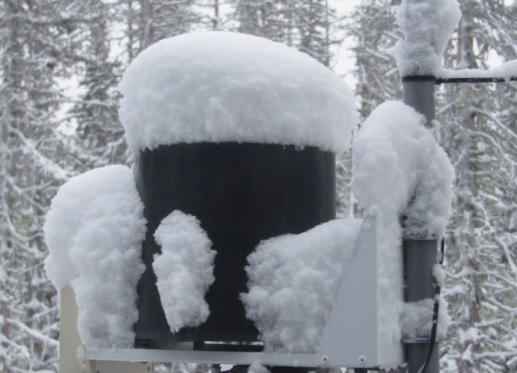
A rimed sensor can occur in the early hours of a juicy storm.
The sensor can still measure temperatures below freezing, though
its response (inside a ball of ice) will be slowed. When the air
temperature rises above freezing, due to the heat of fusion of
water, the temperature inside the melting mass of ice will rise
to and remain at "freezing" as the ice melts. When the sensor
is finally exposed to free air its reported temperature will
abruptly jump to the free-air temperature.
A broken sensor may indicate unusually cold (< -30) or hot (> 120)
temperatures. Back-up temperature sensors are available, which
will be automatically selected if the program judges the primary
sensor to be unreliable. Back-up readings will have a small "S"
or "T" (for secondary or tertiary sensor) included with their
current reading if they have been selected.
About this sensor
The primary temperature sensor is mounted on a tower, on top of
Hoodoo Butte.
"Mid-mountain" temperature is measured near the top of the Manzanita
lift. Elevation-wise this is about halfway up the hill. It should
be about 2F (1C) warmer than the top temperature.
"Base Area" temperature is measured at the bottom of the hill, at
the South Lodge (near the parking lot). It should normally be
about 4F (2C) warmer than the top temperature. This is mostly of
interest when cold air drainage fills the bowl with cold air, while
higher on the hill it can be much warmer.
An INVERSION will be noted whenever the "Base Area" temperature is
cooler than the temperature at the top of the hill.
Humidity
Top    of RED  bar -> Maximum (for hour)
Bottom of RED  bar -> Minimum (for hour)
Bottom of BLUE bar -> Minimum (for period)

The humidity sensor is in the same enclosure as the temperature
sensor.  When rime ice encases the humidity sensor, it cannot
sense what is going on outside.  The humidity reported is that
of the inside of a snowball:  Near, but not quite, 100%.

Wildly varying values might be a good indication of a broken
sensor.  Values stuck level at around 97% might indicate a rimed
sensor, or a slightly drifted calibration exposed to fog (= 100%).
The temperature being above or below freezing could provide a clue.

About this sensor
Wind Speed
Top    of RED  bar -> Maximum (for hour)
Bottom of RED  bar -> Average (for hour)
Bottom of BLUE bar -> Zero

The wind speed is measured in "free air" at the top of a tower
on top of the mountain.  You will probably experience much gentler
winds if you are located elsewhere on the mountain or down amongst
the trees.

"Maximum" wind speed is measured over the span of one minute.
Gusts can have 3 second bursts that go even higher, but we cannot
capture those events.

"Average" wind speed is the vector average of a number of measurements
(over the 48 hour period).  The idea is to understand where the air
which was passing by the sensor at the start of the time period has
gotten to by the end of the time period.
- A day of 25 MPH from the west, followed by a day 25 MPH from the
  east, would vector average to 0 MPH.  After the two days, the air
  is back where it started, and achieved an average speed of zero!

If the "average" wind speed looks too low, look to see if the wind
direction has turned around during the time period.

(This "average" needs to be changed.  While technically correct, it
doesn't provide useful insight.  A simple average of the speeds,
regardless of the direction, would be more useful.)

If this sensor is "broken" it will indicate a zero wind speed.
Historically, the wind on top of the mountain rarely stops for
more than a few minutes.  In severe icing conditions the sensor
may slow or even stop.  When the storm eases or temperatures rise,
the internal heater should help restore it to operation.

About this sensor
Wind Direction
Top of entire  bar -> North = 000 degree azimuth
Span   of RED  bar -> Includes all observed directions
Bottom of the  bar -> North = 360 degree azimuth

"Dir" directions are reported in 8-point compass (N, NE, E, SE, ...)
so the graphical display spans a consistent width.  Labels for
directions like "NNE" would be too wide, so a 16-point compass
could not be used.

Top-to-bottom the graph shows North-East-South-West-North, with
small horizontal lines to indicate the cardinal directions.

If this sensor continuously indicates the same direction, that's a
symptom of a problem.  If the direction is "N"orth, something may
be broken.  Any other direction would suggest that ice has frozen-
down the sensor.

The sensor heaters are usually unplugged during lightning season
(April to September), and turned down in mild weather, so early
and late-season storms may temporarily interrupt the wind speed
and direction sensors.

About this sensor
Barometer
Top    of RED  bar -> Maximum (for hour)
Bottom of RED  bar -> Minimum (for hour)
Bottom of BLUE bar -> Minimum (for period)

About this sensor
Snow depth
Top    of RED  bar -> Maximum (for hour)
Bottom of RED  bar -> Minimum (for hour)
Bottom of BLUE bar -> Minimum (for period)

Short-term variations are primarily due to temperature and
wind effects over the ultrasonic sensing path.

Long-term variations are primarily due to precipitation and
settling of the snow pack under its own weight.  Settling is
a process where air is gradually squeezed-out, and the snow
becomes denser and firmer.

- Snow which falls at temperatures below 20F is very light,
  and will eventually settle significantly.  There is a lot
  of air in "powder" snow.

- Snow which falls at temperatures above 25F tend to be
  denser (= heavier), and will settle faster but less than
  lighter snows.  Not so much air in "mashed potatoes".

- Rain that falls at temperatures near freezing may not melt
  much snow, but can soak-in and add weight which increases
  the settling rate.  Sometimes resulting in "concrete".

- Rain that falls at temperatures well above freezing (>40F)
  can melt part or all of the snowpack.  When the "heat of fusion"
  in the snow is not enough to convert the rain to ice, the
  snow starts to melt.  Water will percolate downward, out of
  the snowpack.  "Slush" that manages to re-freeze may be
  described as "boiler plate", with much less air content, and
  little settling).

Absolutely no variation is an indication of a sensor which
has lost power.  (Sometimes someone turns-off more than
just the lights at night!)

The maximum measureable depth is 204" due to the height of
the sensor above ground level (240.1") less the sensor's
minimum range spec (36").

About this sensor
Snowfall
Snowfall is intended to be an indicator of how much snow a
location has received since the start of the snow season.
The season begins on October 1st, to match the "water year"
used by hydrology folks.

This weather station computes snowfall from its minute-by-minute
snow depth history.

If you visit web sites which track snow pack and precipitation,
like the Hogg Pass Snotel Site, you will discover that this
"metric" is not reported.  That's a first clue that snowfall
is not a rigorously defined and measured quantity.  It's more
of a marketing invention by the public relations folks.

Snowfall might be used for bragging rights, but it's not a
metric that you can verify by visiting a site and measuring
something.  It does not represent how much snow is currently
on the ground, or how much water will become available after
the snowpack melts.

A separate web page about this metric discusses this issue
in more detail.
Precipitation
Top    of RED  bar -> Maximum (for hour)
Bottom of RED  bar -> Minimum (for hour)
Bottom of BLUE bar -> Minimum (for period)

Precipitation is measured from the start of the "Water Year",
which begins on October 1st.  (Start of the rainy season.)

Short-term variations are primarily due to temperature effects.
These are especially observable in the Summer.

When the temperature drops below +5F it appeared (Winter 2006)
that the antifreeze failed, and there were really odd variations.

About this sensor
Static Bursts / Lightning
Top    of RED  bar -> Total counts for the hour
Bottom of RED  bar -> Zero

This data channel provides an indication of the amount of
lightning activity in nearby thunderstorms.  The sensor
counts the number of static "bursts" it hears on an AM radio.

With experience we should understand the detection radius.
Nearby lightning strikes are easy to detect.  More distant
and less energetic storms make it progressively harder to
distinguish lightning from other noise sources.

Some of the counts will not be storm related.  Non-lightning
noise sources, like radio stations fading in and out, cars
with noisy ignition systems, and power line noise, might add
counts.

About this sensor
Rain Gauge
Top    of RED  bar -> Total counts for the hour
Bottom of RED  bar -> Zero

This data channel shows the number of counts from a "tipping
bucket" rain gauge.  Each count represents the equivalent of
0.01" of rain.

This is a "warm season" sensor.  Ordinary rain storms are
measured and reported as they happen.

This is not a "cold season" sensor.  The sensor cannot measure
frozen precipitation until it melts and runs through the unit.
- After a Summer hail storm, it may take hours for it to melt
  completely.
- After a Winter snow storm, ideally it would not melt until
  Spring.


This rain gauge doesn't handle frozen precipitation

In cold weather, when this gauge measures and reports something:
- It could be a long time after the precipitation happened.
- It will take the arrival of different (warmer) weather just
  to start the melting process.
- The time it takes for the ice to melt and be measured tells
  you nothing about when it fell, or how long it took for the
  ice or snow to accumulate.

So if the "rain gauge" indicates that it rained:
- It may not have been rain; and
- It may not have happened when the rain gauge reported it.

If there have been no counts during the web page's reporting
period this section will not be displayed.  This could happen:
- If it has not rained;
- If the sensor has been covered with snow and it's not melting;
- If the sensor has been removed to protect it from cold weather.
- If the sensor's collection funnel drain hole is clogged.
- If the sensor's tipping mechanism is jammed by pine needles.

If there have been counts during the web page's reporting
period this section will be displayed.  This could happen:
- If it has rained;
  - Which may have to percolate through previously accumulated
    snow.
- If it has not rained, but frozen precipitation (e.g. hail or
  snow) collected by the sensor has finally started to melt.
  - Due to heating of the sensor in the sun, or the arrival of
    above-freezing air temperatures.
- If the sensor is being tested for operability.

This sensor's best feature is that its 0.01" resolution can
measure the results of light rain showers in the Summer.  It
can be useful in the Winter, but you need to understand how
and why frozen precipitation may appear to be reported as "rain".

About this sensor
This rain gauge doesn't handle frozen precipitation
In cold weather, when this gauge measures and reports something:
- It could be a long time after the precipitation happened.
- It will take the arrival of different (warmer) weather just
to start the melting process.
- The time it takes for the ice to melt and be measured tells
you nothing about when it fell, or how long it took for the
ice or snow to accumulate.
So if the "rain gauge" indicates that it rained:
- It may not have been rain; and
- It may not have happened when the rain gauge reported it.
If there have been no counts during the web page's reporting
period this section will not be displayed. This could happen:
- If it has not rained;
- If the sensor has been covered with snow and it's not melting;
- If the sensor has been removed to protect it from cold weather.
- If the sensor's collection funnel drain hole is clogged.
- If the sensor's tipping mechanism is jammed by pine needles.
If there have been counts during the web page's reporting
period this section will be displayed. This could happen:
- If it has rained;
- Which may have to percolate through previously accumulated
snow.
- If it has not rained, but frozen precipitation (e.g. hail or
snow) collected by the sensor has finally started to melt.
- Due to heating of the sensor in the sun, or the arrival of
above-freezing air temperatures.
- If the sensor is being tested for operability.
This sensor's best feature is that its 0.01" resolution can
measure the results of light rain showers in the Summer. It
can be useful in the Winter, but you need to understand how
and why frozen precipitation may appear to be reported as "rain".
About this sensor
COUNT 3
Top    of RED  bar -> Total counts for the hour
Bottom of RED  bar -> Zero

This data channel is currently unused.  The software has
been written to display data related to this channel when
it is put into service.

If there have been no counts during the web page's reporting
period this section will not be displayed.  This could happen if:
- There is no sensor to measure anything;
- Nothing is happening which could be measured.

About this sensor
COUNT 4
Top    of RED  bar -> Total counts for the hour
Bottom of RED  bar -> Zero

This data channel is currently unused.  The software has
been written to display data related to this channel when
it is put into service.

If there have been no counts during the web page's reporting
period this section will not be displayed.  This could happen if:
- There is no sensor to measure anything;
- Nothing is happening which could be measured.

About this sensor
COUNT 5
Top    of RED  bar -> Total counts for the hour
Bottom of RED  bar -> Zero

This data channel is currently unused.  The software has
been written to display data related to this channel when
it is put into service.

If there have been no counts during the web page's reporting
period this section will not be displayed.  This could happen if:
- There is no sensor to measure anything;
- Nothing is happening which could be measured.

About this sensor
Light Level
Top    of RED  bar -> Maximum (for hour)
Bottom of RED  bar -> Minimum (for hour)
Bottom of BLUE bar -> Zero

Spikes seen during night-time hours are usually due to the snow
grooming equipment passing by with their flashing lights.

"Twilight" - Sun's center is 6 degrees below the horizon.
           - This is the definition of "civil twilight",
             which is about the time it becomes too dark
             to work or play outside.
"Sunrise" & "Sunset" - Sun's upper limb is on the horizon
"Moon Phase" - The sign indicates waxing (+) or waning (-).
             - The number is the percent of a full moon.
               e.g.   +1% = just after new moon
                     +25% = waxing crescent
                     +99% = just before full moon
                     -99% = just after  full moon
                     -75% = waning gibbous
                      -1% - just before new moon (or solar eclipse)
             - The number changes 1% every 3.54 hours.

About this sensor
Power rail
The power rail is what supplies power to the datalogger.
It can be driven by either a plug-in power supply or a
back-up battery.
- When commercial power is available it is steady at
  about 13.0 Volts.
- In the event of a power failure the batteries provide
  a lower voltage, which will decline as they become
  exhausted.
- The minimum operational voltage for the datalogger
  (the data collecting part of this weather station)
  is 9.6 Volts.
Common to all of the data section graphs:
Max. & Min.
"!" indicates a where a maximum or minimum occurred if the value
is not printed.
Hour - Time-axis labels
The number is the hour in 24-hour format:
                           0 -> Midnight
                           6 -> 6 AM
                          12 -> Noon
                          18 -> 6 PM
Other notes:
- Background pictures
Views of various mountains as seen from the weather station site.

These include Mt Jefferson, Three Fingered Jack, Black Butte,
Cache Mountain, Mt Washington, North Sister, Middle & South Sister
and Iron Mountain.

The picture is changed every hour.

The pictures are intentionally small (to minimize download time),
low-contrast and grey (to provide texture, but not interfere with
the page's readability).  The "embossed" image option was used to
highlight the remaining edge contrast.
More information about the sensors used to measure the above
parameters is available at "About
this weather station".
2016 12/13 - Had to re-format this whole file. Hopefully most
of the problems got corrected. If not, let me know ...