Snow Depth & Snowfall - Start of 2010-11 Season
If you are a skier, you spend most of your time on top of the snowpack. :-) Snow depth (a different "metric") is far more useful in determining how well the terrain (rocks, stumps, roots, etc.) is covered. Recent snow depth history, along with temperature and wind information, can be useful in estimating how fun (and safe) the top (and the rest) of the snowpack may be. These metrics are discussed elsewhere.
Snowfall is about how much snow has fallen since a starting date. For this station we start at the end of the dry Summer weather, before the rainy season starts. The Hydrology folks in this area start their "water year" on October 1st, so we will do the same. It's a compromise which may fail to include an early snow, but also tries to exclude fire-fighting water drops. Rain, snow, and fire seasons can overlap.
Snow sports, like skiing, generally interact with just the top few inches or feet of the snowpack. Depending on the terrain, it takes a certain amount of snow depth to safely bury obstacles like rocks and trees. After the "base" is deep enough, interest turns to the quality of the top-most layers of snow. The questions being asked become "When did it fall?", "How much?", and "How fluffy is it?"
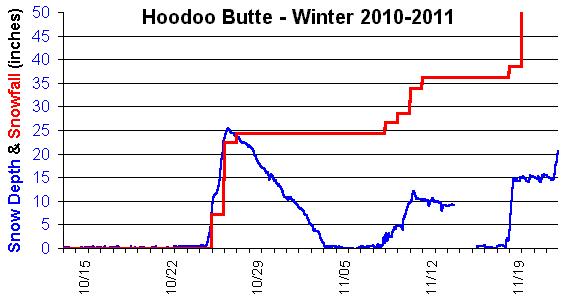
In mid-November of 2010, after the season's first two storms, "Total Snowfall" stood at about 36 inches. The snow depth was 0 inches, because rains had melted it all away. If you had wanted to go skiing, and had visions of three feet of snow at the reporting site, you were going to be very disappointed.
Water sport and irrigation folks anticipate the use of the snowpack after it melts. It's the volume of water that comes out of the snowpack that determines how much will be available to fill the reservoirs in the future. Not all of the snow that fell during the season remains in the snowpack.
If you had a particular amount of snowfall, the amount of water it could yield can vary widely. An inch of rain, if it had fallen as 14 degree F "powder" snow, might add 20 inches to the snowfall total. That same amount, falling as 32 degree F "mashed potatoes", might add just 5 inches to the snowfall total. So every inch of the snowfall total can represent a different amount of water equivalent after it melts.
Neither snowfall, nor snow depth, are accurate predictors of how much water will become available.
Ski areas are highly sensitive to snow depth and density in early season. They need not only depth to cover the ground, but also density to resist the abrasive impacts of ski traffic and snow grooming equipment. A few feet of a dense base layer might allow a few weeks of operation, while the same depth of "bottomless powder" might not allow an opening day if it packs down too thin.
Marketing folks probably like the snowfall metric because the bigger numbers look more impressive. And it never decreases, despite the weather. Snow depth, on the other hand, suffers terribly when the precipitation turns to rain.
There are other places with greater snowfall totals, and we should gracefully acknowledge their right to brag about it. This site's snowfall amount is by comparison, quite modest. We get our occasional "big" storms, and it may be with some relief that the snow to be shoveled isn't the much larger amounts reported elsewhere.
We can track the snow depth, and temperature, and try to detect when snow begins to accumulate at the beginning of a storm, and when it has stopped at the end of the storm. Increasing snow depth (below 35 degrees) is a pretty good indicator that it's snowing. When the snow depth levels-out, starts dropping, or the temperature rises above 35 degrees, snow has probably stopped falling. This may seem obvious, but a look at the raw data shows that the analysis is not this simple.
Snow is a highly variable material. What falls as fluffy flakes, after being covered by additional snow, is compressed due to the weight of the snow above it. This "settling" process continues as long as air can be squeezed out of the snow. In a glacier it takes years to convert layers of white snow to deep-blue solid ice. (The color relates to how much air the ice and snow still contains.) The white snow in an annual snowpack implies there is still a lot of air in the snow, so the snowpack is always settling.
The "settling rate" in the snow depth is mainly determined by the temperature and overall depth of the snowpack. Warm and deep snowpacks settle faster, and if rain doesn't melt the snow, it hastens the compaction process and replaces some of the air. During the course of a long snow storm, snow which fell early will be compressed by later snowfalls. Add to that the underlying snowpack's settling rate, and you are at best measuring a moving target. The snow depth sensor measures the top of a new snowfall layer, but we also need an estimate of where the bottom of the new layer is, in order to compute a snowfall amount. Not correcting for settling in the snow base, and in the newly fallen snow layer, tends to under-estimate the "snowfall" amount.
The snow depth sensor is mounted on a wooden mast. Many days, around noon time, the sensor indicates a drop in the snow depth, which recovers to its earlier depth a few hours later. Did some snow melt, and then more snow fall? Usually not. But the data has this feature in it, and too simple of a snow fall algorithm might claim an inch or so of snowfall every day this data anomaly happens. The actual cause for this is not understood. It may be the mast warps due to the sun heating it on one side, or perhaps the sound velocity temperature correction is getting fooled. (Temperature sensor heated by the sun, but the air is cool in the shadows of the surrounding trees.)
The snow depth sensor uses an ultrasonic "click" to echo-range the top of the snow pack. It works pretty reliably, but sound traveling through open air can have its challenges. A wind gust may bend the sound beam, sending it on a longer path. The later return echo would be interpreted as a shallower snow depth. This sort of one-sided "noise" is often seen in the data, so individual measurements should not be believed unless they tend to agree with other measurements taken at about the same time. The analysis should never mistake one data point's anomaly for snowfall.
Every measuring technology and data analysis method probably has strengths and weaknesses, and good results are probably not going to happen until you understand and account for the major weaknesses. Testing the analysis with historic data helps to identify unexpected sources of error, as nature is usually more complex than what we initially expect. Properly interpreting historic data, and verifying performance with real-time results, are both useful in developing an analysis process that you can trust.
An example of the unexpected: November 2014: The sky is clear, there has been a cold and strong east wind after a recent snowfall. The snow depth sensor sees the depth increase by over an inch in the course of several hours. Snow is probably blowing, drifting, and accumulating in the area near the snow depth sensor. The increase in snow depth is happening because some other area is losing its snow. It's a bit unethical to claim this as part of the season's snowfall total if the metric is intended to apply to a large area. IF, however, we were on the high desert and trying to measure the benefit of snow fences to accumulate drifting snow, this is exactly the situation we would be seeking to measure. So the purpose of the measurement may affect whether (or not) this is type of event would be considered to be a false report. If this turns out to be significant, we'll probably have to find a way to ignore this type of event.
It might be interesting to understand how other folks take measurements and compute their snowfall metric. (And to understand the strengths and weaknesses of those methods.) Automation is great for consistency, but people can easily do things which are too hard or expensive to automate. (Like cleaning-off a snow accumulation surface.) They may also notice when things "don't seem right", like drifting snow being falsely reported as new snowfall. Automation doesn't think about whether what it's doing is correct or not, it just "follows orders".
This method under-reports the snowfall amount, as it does not account for settling in the snow depth over time. To be reported, any new snowfall would need to overcome the settling since midnight, and then increase the snow depth by at least the threshold (0.5"). That becomes an ever-bigger handicap as the "base" snow depth increases, and for large amounts of new snow.
This method would over-estimate the snowfall amount if "noise" in the data included significant positive excursions. Experience has shown the noise in the data to be almost exclusively negative excursions, with positive excursions of just a few tenths of an inch. This is not a significant problem, so filtering the highest snow depth for the day is not done. The "exceeds 0.5 inch" requirement was selected to balance over- and under-reporting errors.
Some of the steps in this analysis are intended to suppress the effects of noisy readings, based on experience in looking at the data and previous analysis attempts. Additional tuning may be possible to better balance the exclusion of noise-inspired amounts, while more accurately including real snowfall amounts. For now, it provides a rough conservative estimate.
2013 11/14 - Created, first-pass edits.
2013 12/07 - Algorithm notes added after the first version of an analysis program was completed.
2013 12/09 - Second-pass edits completed. Added the graph.
2013 12/21 - Changed threshold to include a snowfall from 1.0" to 0.5"
2014 01/11 - Minor text edits
2014 11/11 - Rewording & reorganization for smoother reading
2016 01/19 - Minor text edits (related to "settling")