
Graph of 1998 to 2002 data - Original location
Graph of 2002 to 2018 data - Current location
Graph of data since August 2018 - With new building
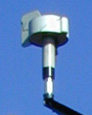 Wind Speed Sensor -
http://santiampassskipatrol.org/wx/weather13.htm
Wind Speed Sensor -
http://santiampassskipatrol.org/wx/weather13.htm
The wind direction sensor is mounted on a tower on top of Hoodoo Butte, next to the wind speed sensor.
Now the bad news: Due to construction in the Summer of 2018 a building was erected close to the wind sensors. About thirty feet away, and the top of the building's roof is near level with the wind sensors. This disrupts the wind flow in the vicinity of the building, which affects the wind sensors for this weather station.
On the weather page this problem can be seen in the width of the azimuths reported in the wind section. Steady winds, like from the east, typically show as a very narrow line. When that band expands, that's a symptom of turbulence in the form of vortices being shed by an obstruction. We used to see it with south winds prior to the removal of the Bend Broadband building.
This problem is best appreciated when it's windy and the wind direction sensor is observed to be swinging about or even spinning, instead of "weather-vaning" into the wind. A 26 second video clip (59.7 MBytes) shows this happening. In this video the wind direction sensor is on the left. The wind speed sensor (on the right) is supposed to spin when it's working correctly.
Bad news continued: Admittedly the new building only affects winds coming from its direction, which is the southwest. In this area, most storms come from . . . the southwest. So the ability to accurately measure wind direction during major storms has been compromised.
In the winter, snow deposition and avalanche hazard areas are driven by the wind. Without good directional information, avalanche hazard estimates are less certain until you go into the field. We can't rely on the remote sensors.
The weather station was originally mounted on top of a chairlift tower on the original "Green" chair in 1998. When the chairlift was replaced in 2002 the sensors were moved to their current location, on top of a tower about 100 feet west of the original location. In about August 2018 the new building's construction revealed how it might affect the weather station.
The weather station logs readings every minute, so aside of some data outages (like when the charlift was demolished and replaced), we have several years of data which can be evaluated.
The current location was reasonably close to the radio site's previous building which was located to the south. South winds are relatively infrequent, so it was a known but not severe problem.
Analysis: Imagine taking a series of observations over the course of a day, a week, a month, or an entire year, and look at how well the reported wind direction correlates to a reading one minute later.
A two-dimensional array could be created with counts of how many times a specific situation occurs: One array axis would be the first-reading's azimuth (i.e. 0 to 359 (degrees)). The other array axis would be the difference between the first- and second-reading's azimuths (i.e. 0 to 180 (degrees)).
Each of the 360 * 181 cells in the array would contain a count of how many times that situation occurred in the time period of interest.
Visualizing three dimensions of data (Azimuth, Delta-azimuth, and Counts) in this array is not easily done in the two dimensions of a static web page. This might be a good use for a 3D printer . . . but we'll see what can be done and eventually present it here . . .
Graph of 2002 to 2018 data - Current location
Graph of data since August 2018 - With new building
Turbulence which causes the sensor to swing wildly or spin will result in a graph that spreads the counts across most all azimuths, as half of the time an inaccurate azimuth will be the "first-reading"'s azimuth. It is expected that troublesome azimuths will be plainly evident compared to good azimuths, despite this "noise floor" in the counts.
Since the new building has disrupted the airflow, and the building is likely not moving, the wind sensors will need to be moved. Easily said, not so easily done, as the sane season for hill-top construction runs from about July to October. Late Fall and early Winter is not the right time for digging trenches and tower work.
A retired chairlift tower should become available after this year's construction wraps up. It had been used since Fall 2017 to temporarily support cell phone antennas, and should be available after the antennas have been transplanted to the new radio tower. It's located about eighty feet to the east of the current weather tower, and is a bit taller. We may need to add streamers to test the air for turbulence, but it looks like a much better location.
2018 10/06 - First pass
2018 10/07 - Second pass - minor tweaks